loading ...

What to visualize?

Scenarios


A Benefit Gap in water quality regulation can be measured by nitrogen export, the amount not retained by vegetation that therefore enters waterways and drinking water supplies as pollution.

How to read these maps

These maps display high resolution global datasets for 4 metrics of interest: Benefit Gap (the potential benefit not provided by nature), People Exposed (to the benefits or benefit gaps), Maximum Potential Benefit (arising from human stressors and/or physical conditions), and Nature's Contribution (to providing potential benefits). When a metric is selected, a short description will appear below. Please refer to the modeling method for further details on each metric.

The bottom map displays the baseline data (year 2015), and the top map shows the change (by 2050).

To select a scenario (SSPs, 2050), as well as which metric to visualize, click on its name in the menu on the left panel.


Water Quality

Water quality

Fertilizers like nitrogen are a major source pollution to freshwater systems and drinking water. However, some of it may be retained by healthy ecosystems, regulating drinking water quality to downstream populations.

Modeling method

Modeling Method

NCP Framework

Nature's Contributions to People (NCP) Framework

The contribution that nature makes to potential benefits is a function of the amount and configuration of biodiversity and ecosystems, as well as with other drivers and stressors placed on the natural system such as climate change or pollution from anthropogenic inputs (e.g., fertilizer run-off). However, these biophysical measures indicating potential benefits may or may not coincide with where and how much people depend on the benefits from nature. Thus, the additional consideration of which populations are most dependent on nature’s role in delivering benefits is critical to establishing where these potential benefits and nature’s contributions to providing them matter to people.


Water Framework


Water Framework

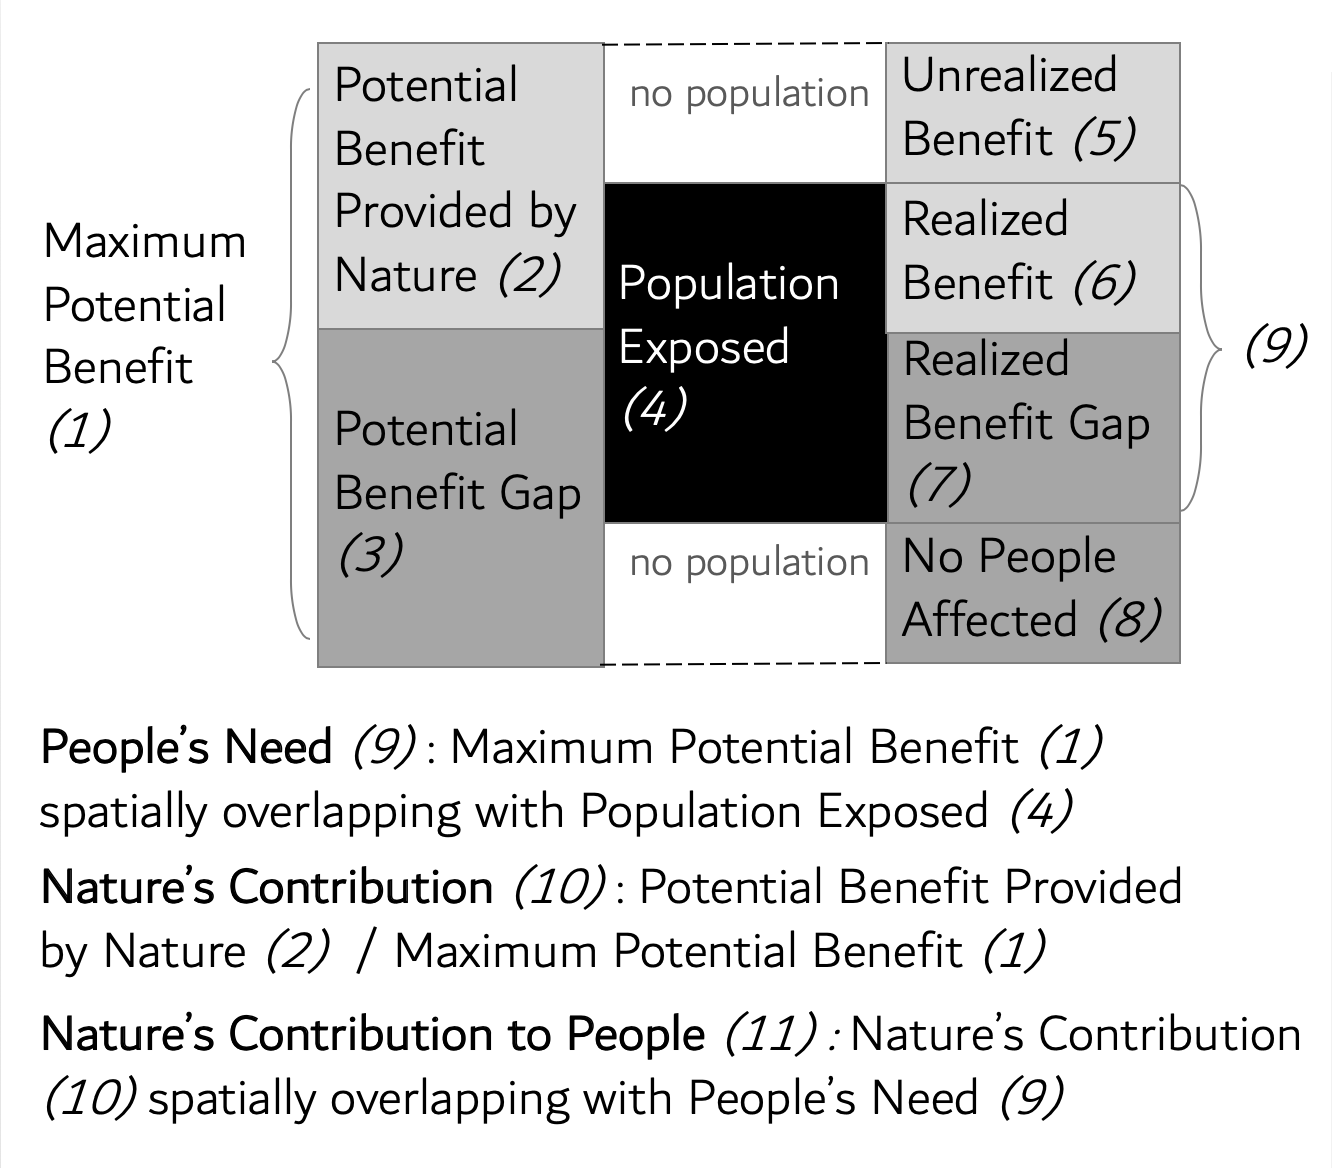
In the case of water quality regulation, the maximum potential (mitigation) benefit in a given region or watershed is the total amount of pollutant (i.e. nitrogen load) requiring retention by vegetation in that area. We use rural populations (within 100 km watersheds) as the population exposed because they are presumably less likely to have water treatment options. The potential benefit provided by nature is nitrogen pollution retention; and we can characterize nature’s contribution as the proportion of total nitrogen pollutant load retained by ecosystems.

The potential benefits provided by nature, which are often called “ecosystem services” (but should be thought of as the potential supply of a service, and only truly becomes a service when combined with human demand for the service, shown as the realized benefit) may be measured in terms of tons of pollutant retained. We emphasize that a proportional representation of nature’s contribution to providing potential benefits is important to track differences or changes across space and time; as realized benefits provided by nature could increase alongside (or due to) increases in maximum potential benefits or population exposed, though nature’s contributions may remain the same. That is, if pollutant run-off increases from elevated fertilizer use, a constant proportional contribution of nature would result in higher levels of the corresponding realized benefits, pollution retention, even if conditions for people (in terms of water quality) deteriorate. The relative proportion of nature’s contribution, along with people’s needs, especially for the most vulnerable people, are more useful metrics than realized benefits alone when considering change across several variables at once (stressors, people, and nature), as they reveal where and when nature plays a key role in delivering benefits.

We also examine the benefits not provided by nature, or benefit gaps, people depend upon for their well-being (which could be filled to some extent by other forms of capital, e.g., infrastructure), and the populations exposed to changes in benefit gaps for each NCP in future scenarios. We use nitrogen export (the amount not retained by vegetation that therefore enters waterways and drinking water supplies as pollution) as the measure for the benefit gap in water quality regulation. This benefit gap results in the outcomes people will actually face and perceive – drinking water pollution in this case— and is what will determine people’s well-being, the visible component of NCP. It does not by itself, however, reveal the role nature plays in contributing to that well-being.


Modeling Water Quality Regulation

We first model nitrogen load, export, and retention (the difference between load and export) via the InVEST Nutrient Delivery Ratio model. This model maps nutrient sources from watersheds and their transport to the stream. The model does not represent the details of the nutrient cycle but rather represents the long-term, steady-state flow of nutrients through empirical relationships. Sources of nutrient across the landscape, also called nutrient loads, are determined based on the LULC map and associated loading rates, and delivery factors are computed for each pixel based on the properties of pixels belonging to the same flow path (in particular their slope and retention efficiency of the land use).

We then use these outputs along with data on rural populations (which we assume to have lower access to water treatment) to determine humanity’s needs and nature’s contributions, as the dual components of NCP.

Data

All data displayed is publicly available here

Full methods will be available upon publication, in the Supplementary information of Chaplin-Kramer et al (2019)

References

  • S. Diaz et al., Science. 359, 270–272 (2018).
  • S. Diaz et al., Curr. Opin. Environ. Sustain. 14, 1–16 (2015).
  • U. Pascual et al., Curr. Opin. Environ. Sustain. 26, 7–16 (2017).
  • I. M. D. Rosa et al., Multiscale scenarios for nature futures. Nat. Ecol. Evol. 1, 1416–1419 (2017).
  • See InVEST NDR User's Guide for detailed explanation on the model.


Image